Your raffle analytics
Reading your sales numbers, where your buyers came from, and the split between RaffleLink and cash sales.
The Analytics page for a raffle tells you how it's tracking — what you've raised, how tickets are selling over time, and where the sales are coming from. If you run both online and in-person, it's also where the two are pulled apart.
It's split across three tabs: Overview, Sales, and Buyers.
Overview
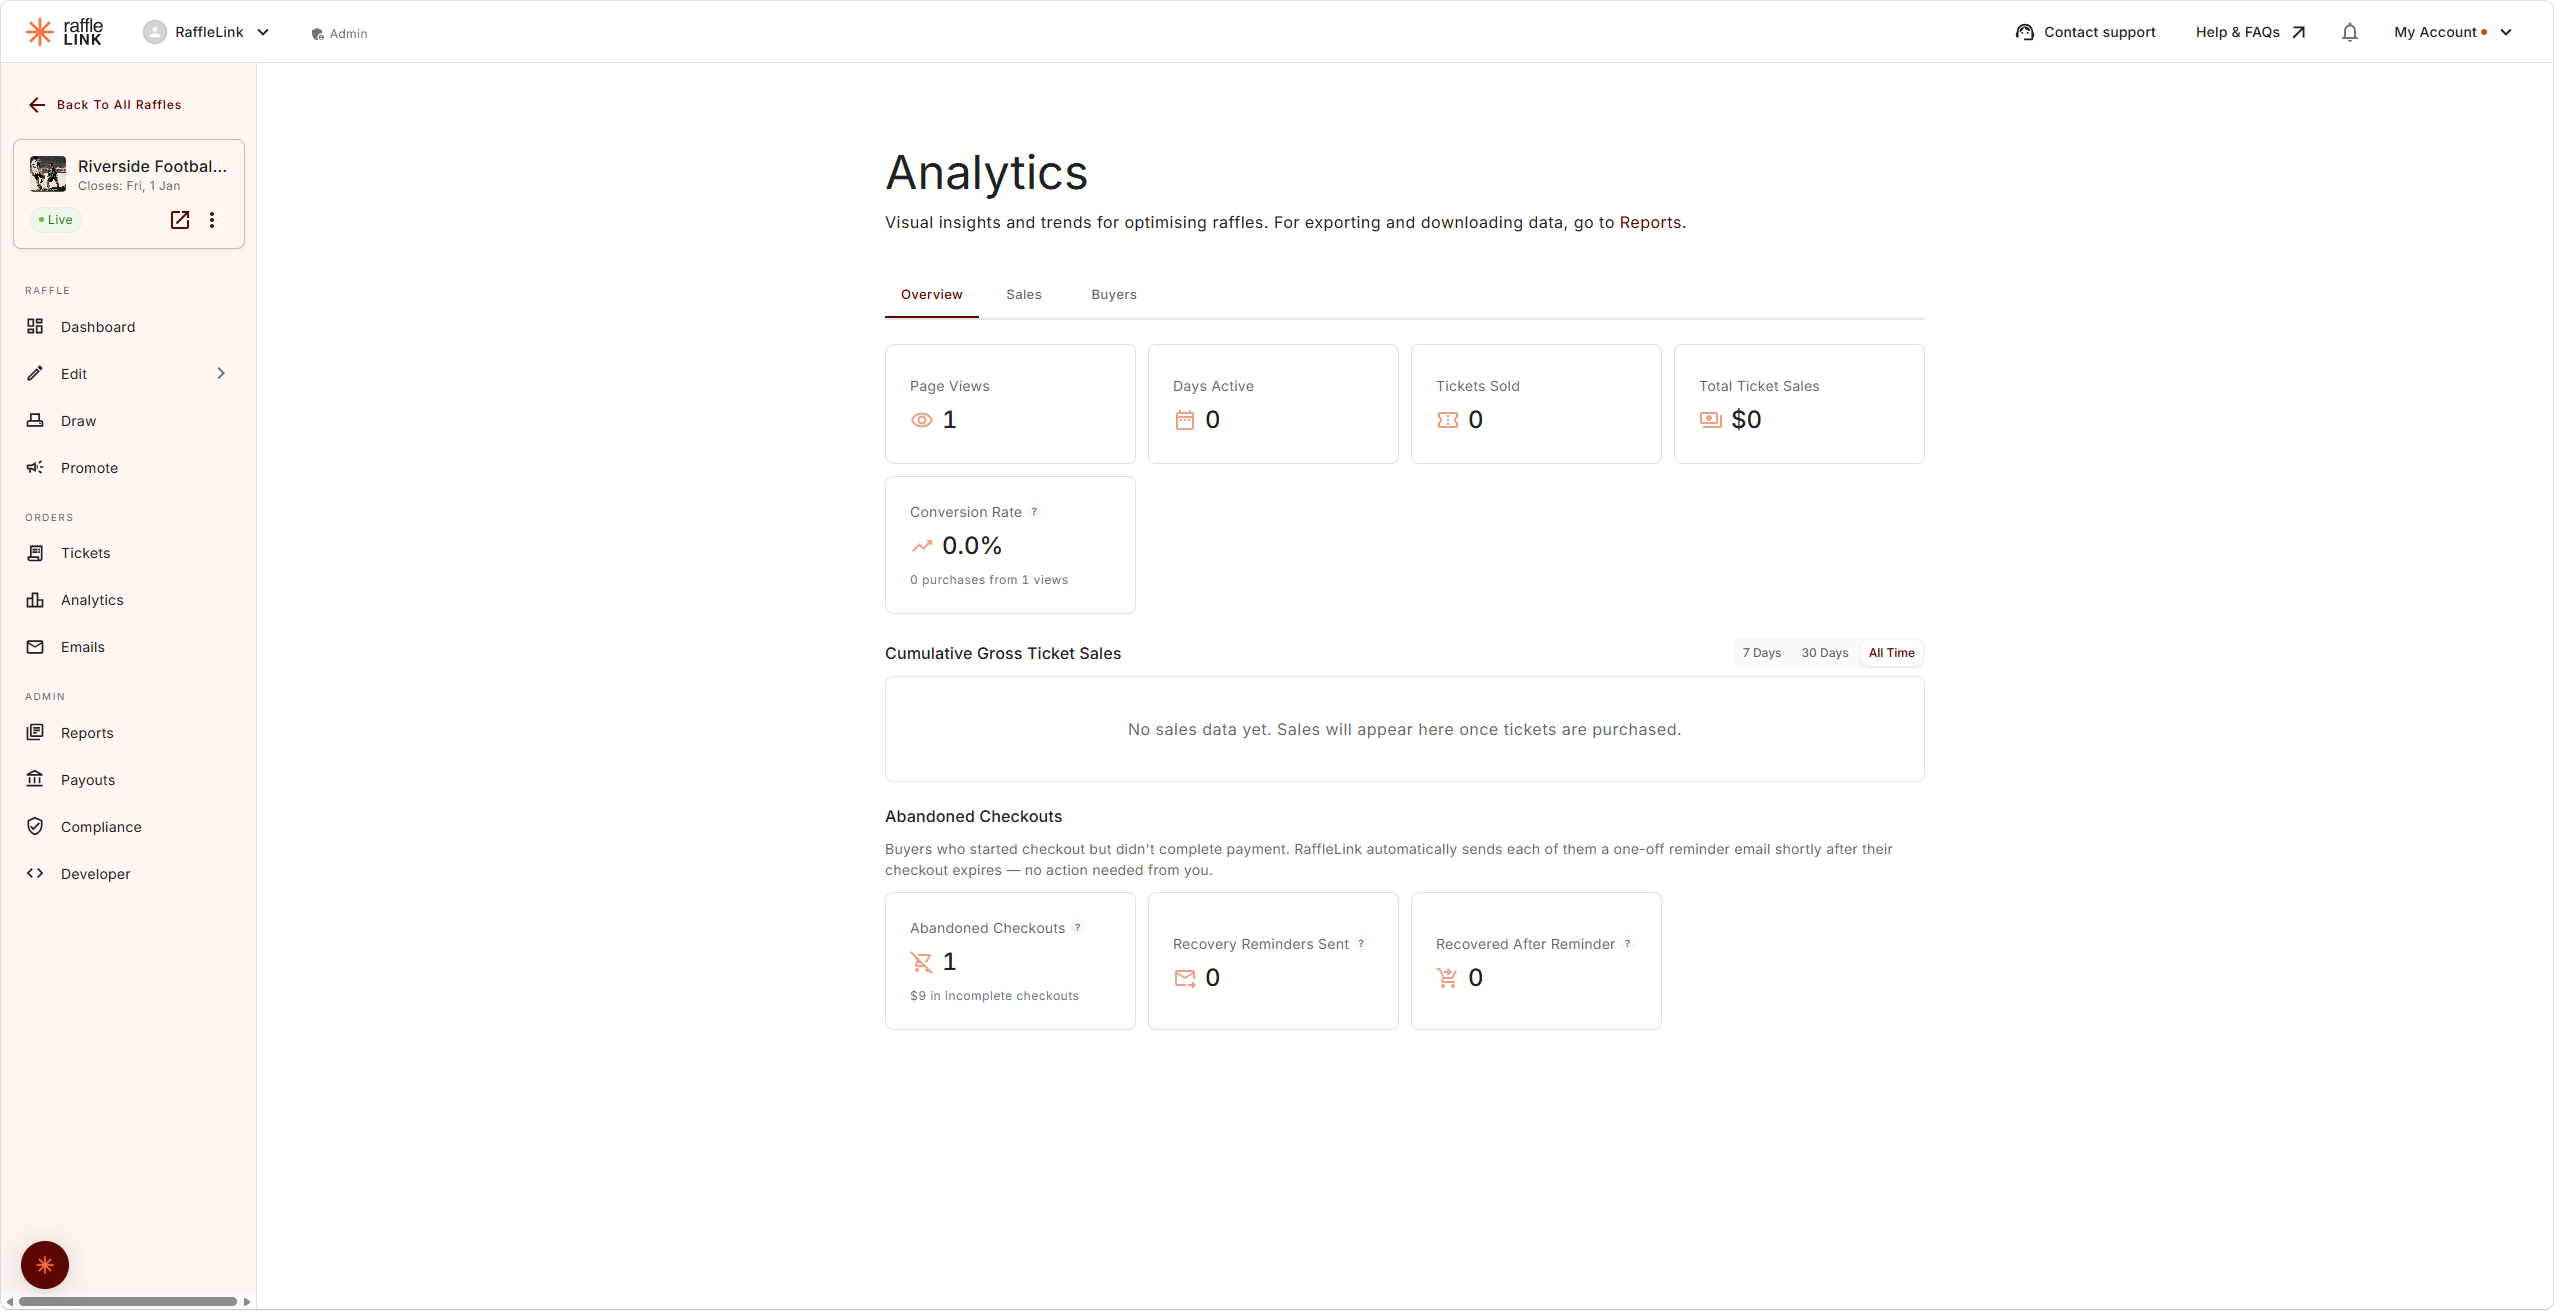
At the top you'll see the headline cards — Page Views, Days Active, Tickets Sold, and Total Ticket Sales, joined by Fee Assistance and the channel split when they apply to your raffle. One worth knowing:
- Conversion Rate — the share of raffle page views that ended in an online purchase, shown as "[n] purchases from [m] views". In-person sales are left out, since those buyers never saw the page.
(Looking for Net Fundraise — what your raffle is actually raising after fees, across every channel? It's a column in the Sales tab's daily breakdown, and the headline figure on your reports. For exactly how it's calculated, see How the money works.)
The sales chart: cumulative or per day
Ticket Sales Over Time now comes in two views, switched with the toggle beside the chart title:
- Cumulative (the default) — your running total, the classic "how are we tracking?" line.
- Per Day — what each individual day took. This is the view for judging your promotion: a strong email or post shows up as a clear spike, and a run of quiet days stands out instead of hiding inside a gently rising line. Days with no sales show as zero rather than being skipped.
Either view can be narrowed to the last 7 Days, 30 Days, or All Time.
Abandoned Checkouts
Below the sales chart, an Abandoned Checkouts section appears once anyone has started a checkout without completing payment. It shows three figures:
- Abandoned Checkouts — how many buyers entered their details but never paid, and the value of those incomplete checkouts. These amounts are never counted in your sales figures.
- Recovery Reminders Sent — RaffleLink automatically emails each of those buyers a one-off reminder shortly after their checkout expires. No action needed from you, and a buyer only ever receives one per raffle.
- Recovered After Reminder — reminded buyers who came back and completed a purchase, and what they spent. That revenue is in your sales figures.
The follow-up is fully automatic — there's no list of abandoned buyers to download or email, by design. People who haven't completed a purchase haven't agreed to hear from the organiser, so RaffleLink sends the one reminder on your behalf and leaves it there.
The channel split
If your raffle takes both online and in-person sales, analytics separates them so you can see each clearly:
- RaffleLink Sales — processed by RaffleLink (online purchases, plus Tap to Pay sales taken with the Ticket Booth app).
- Cash & POS Sales — collected directly by you at the booth (also shown as Ticket Booth Sales in some places — same money).
A raffle that only sells one way shows a single column; a hybrid raffle gets the split. The tooltips on the page explain each term in situ.
Sales
The Daily Sales Breakdown shows you momentum day by day — where the spikes are (often right after you send an email or share the link), and whether you're building toward your close. Use it to time your nudges: a quiet stretch is a good moment for a "draw's coming up" email.
Pricing Metrics sit alongside it — average price per ticket, average transaction value, and average tickets per transaction — useful for judging whether your ticket packs are doing their job.
When Buyers Buy maps online purchases by day of the week and time of day, so you can see when your audience actually converts — and schedule your posts and reminders to match.
If you're selling paper tickets too, those are tracked separately at the bottom of the tab.
Buyers
Where Your Buyers Came From breaks your online sales down by the kind of link people arrived on — social media, search, email, SMS, QR and print, your own website, RaffleLink itself, or a direct link. Sales from before this tracking existed show as Untracked, so an established raffle may look lopsided at first.
Sharing the tagged links from your Promote page is what makes this accurate — an untagged link can only be counted as a direct visit.
New vs Returning Buyers splits this raffle's buyers into people who've never bought from you before and supporters coming back, and shows how many of them follow your organisation — the ones who'll be emailed automatically when you launch your next raffle.
You'll also find your Top 5 Transactions (your largest orders) and Sales by State, showing where your buyers are.
Two different meanings of 'channel'
This page uses the word twice. The RaffleLink vs Cash & POS split above is about who processed the money. Where Your Buyers Came From is about how people found you. A booth sale has a money channel but no traffic source; an online sale has both.
To download the underlying data, use the Reports page rather than Analytics — see Tax invoices and reports.
Two names, same money
You'll notice in-person sales sometimes labelled Cash & POS Sales and sometimes Ticket Booth Sales. They refer to the same thing — money you collected directly at the booth rather than RaffleLink processing it. The "Cash & POS" framing emphasises how it was paid; the "Ticket Booth" framing emphasises where it came from.